Help & Documentation
A guided tour of ArthroVerse, following the main navigation menu. Use the quick links below to jump to a section, or read top to bottom for a full walkthrough of browsing protein families, exploring samples and scaffolds, and running sequence searches.
Browse
The Browse menu is the main way to explore the contents of the database. It groups the data by the level you want to look at: protein Families, sequenced Samples, individual Scaffolds, the host the sample came from (By Host), or a geographic Map. Each view shares a common pattern: a filter form at the top, a sortable results table, and pagination controls at the bottom.
Families
Browse the protein families catalogued in ArthroVerse. Each row links to a detailed Family Info page with the representative sequence, taxonomic and order distributions, functional and structural annotations, and a 3D model where available. You can filter the list by:
- Family name & Category — free-text search boxes.
- Taxonomy — restrict to a chosen taxonomic group.
- 3D model quality — filter by the confidence of the predicted structure: High Medium Low
- pLDDT and pTM score ranges — drag the sliders to keep only models within a confidence band (each runs from 0 to 1). Tick the checkbox to enable a range filter before searching.
Click any column header (Family, Members, pLDDT, …) to sort; click again to reverse direction. The Records and Page pills show how many results matched, and the Show selector changes how many rows appear per page.

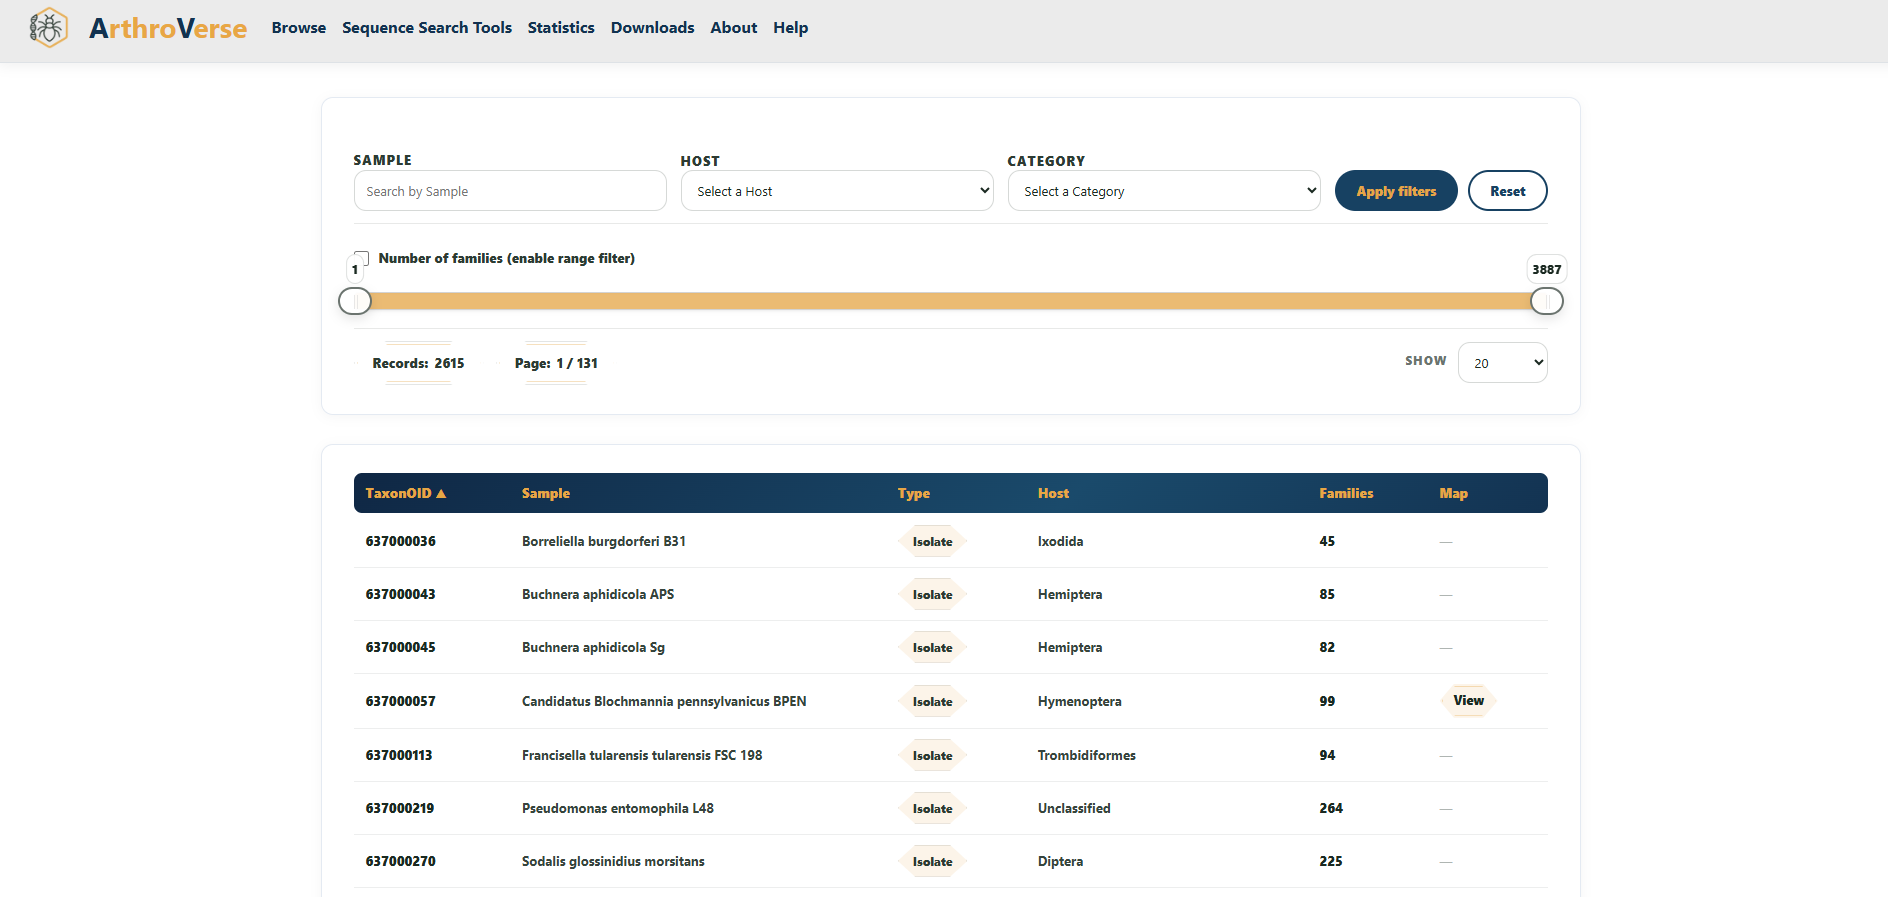
Samples
Samples (datasets) are the sequenced metagenomes, isolates, and metatranscriptomes the families were derived from. Each row shows its TaxonOID, sample name, type, host, and the number of families detected in it. Filter by:
- Sample — search by name.
- Host — select the host organism.
- Category — Isolate, Metagenome, or Metatranscriptome.
- Number of families — enable the range slider to keep only samples within a chosen family count.
Click a TaxonOID to open the full Sample Metadata page (sequencing details, project & publication links, environment, sampling conditions, assembly stats, and a map of the collection site). The families count links to the families found in that sample, and the Map column opens the exact coordinates in Google Maps.
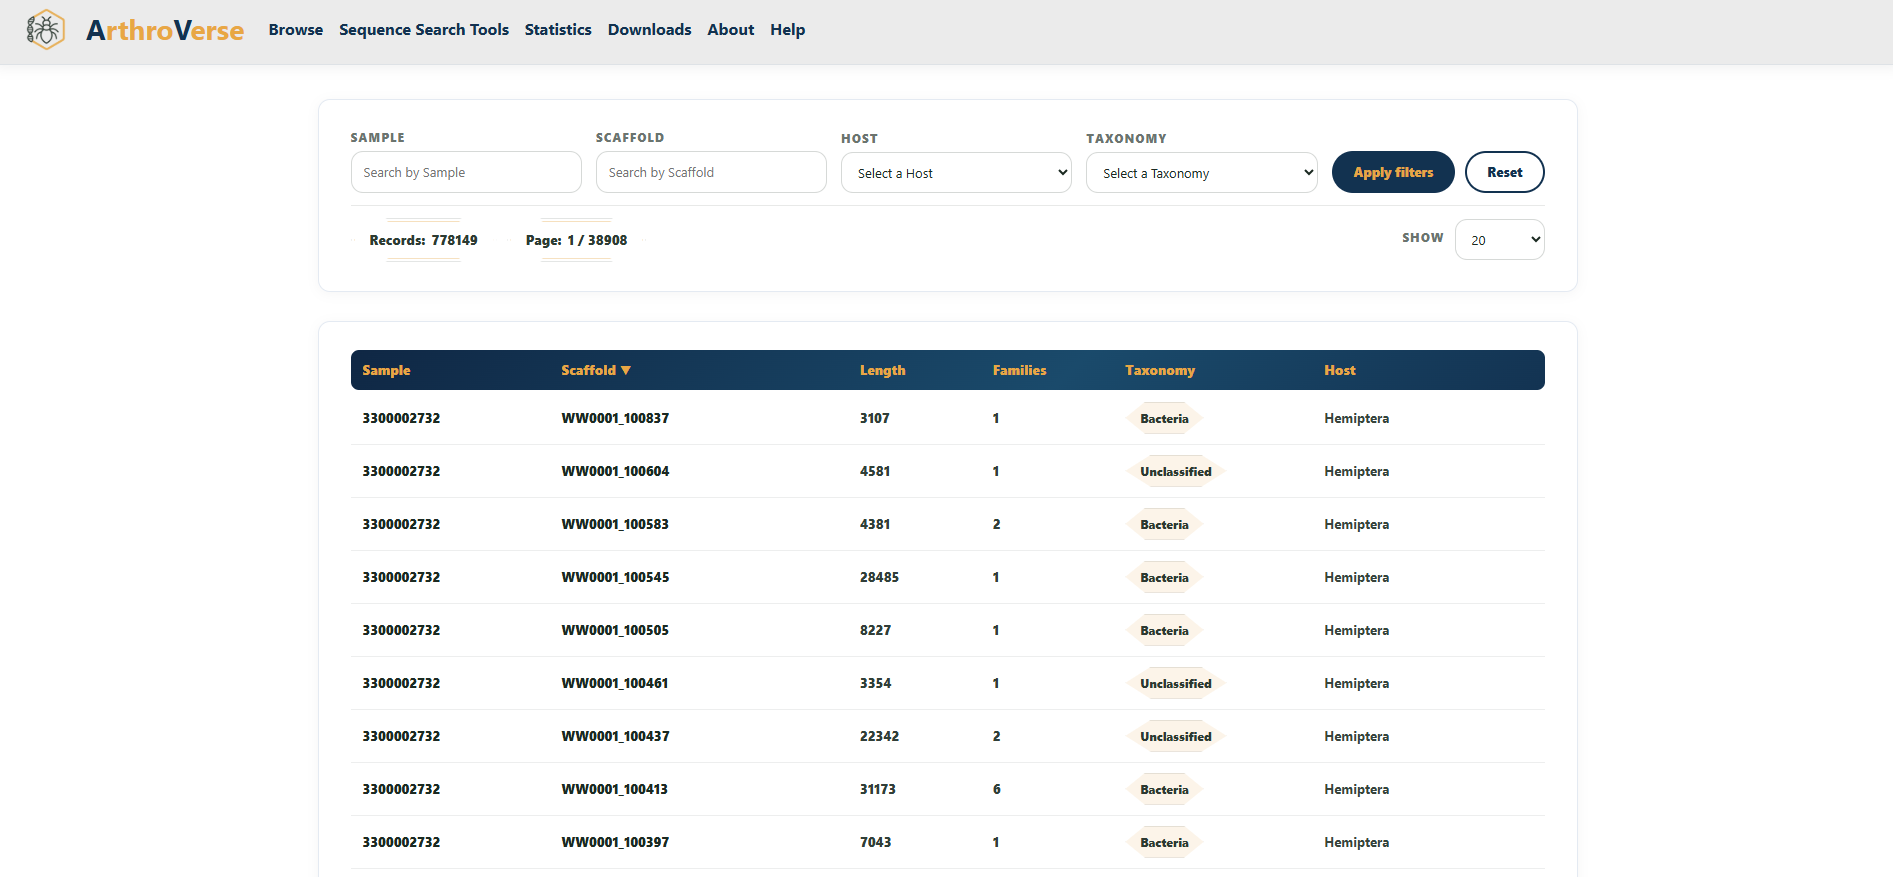
Scaffolds
Scaffolds are the assembled contigs within each sample. The Scaffolds view lets you search across the whole database by Sample, Scaffold ID, Host, or Taxonomy, and sort by length or number of families.
Selecting a scaffold opens its Scaffold Information page, which summarises sample, taxonomy, environment, and lineage, and shows every protein family on that scaffold as a clickable honeycomb. Links out to IMG/JGI are provided for the original assembly record.
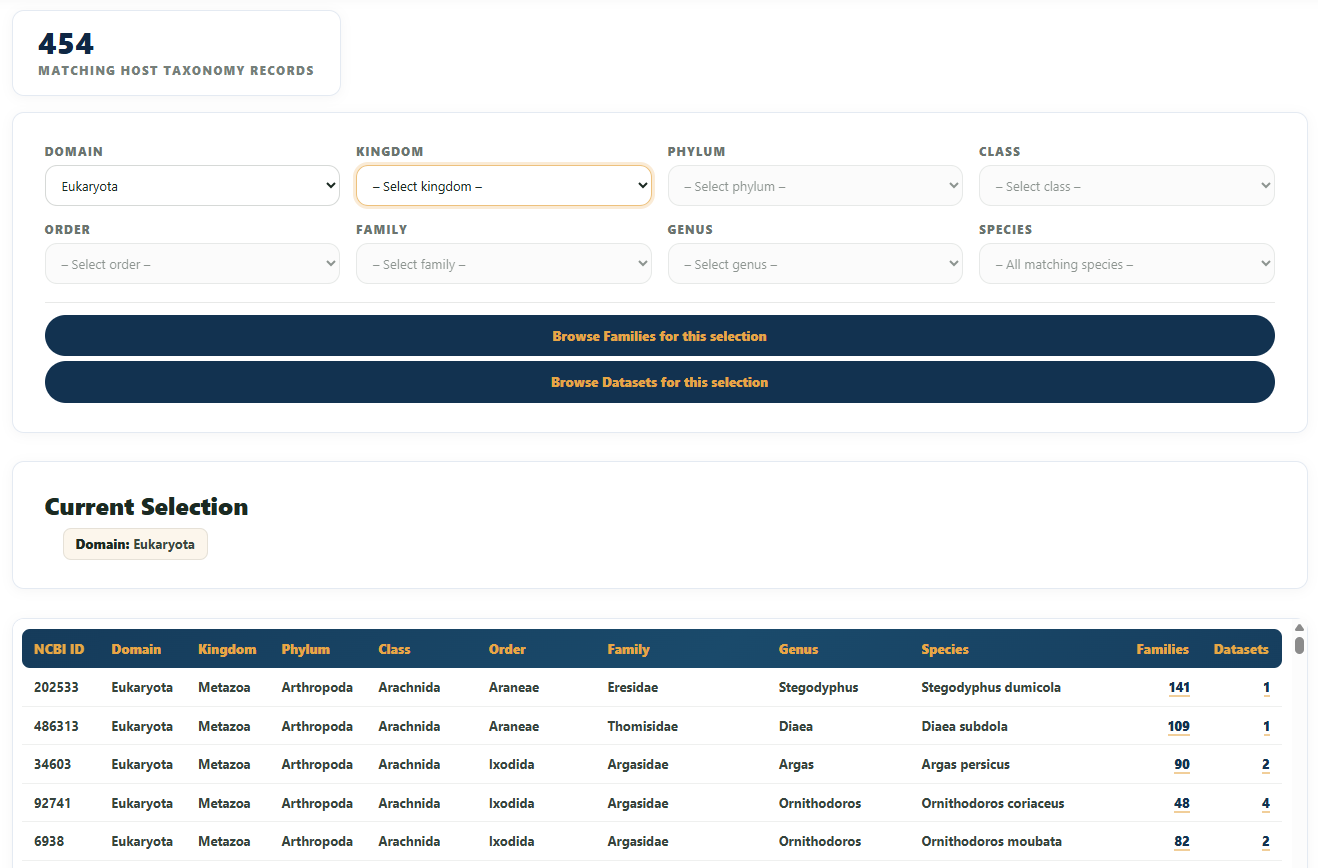
By Host
By Host lets you start from a host organism's taxonomy and drill down through Domain → Kingdom → Phylum → Class → Order → Family → Genus → Species. Each dropdown unlocks the next once a value is chosen, and a summary of your current selection appears below the form.
The results table lists every matching host-taxonomy record with its NCBI ID and counts of associated Families and Datasets. Use the Browse Families / Browse Datasets buttons (or the count links) to carry the host filter across to those views — you'll then see a Host Taxonomy filter summarised at the top of those pages.
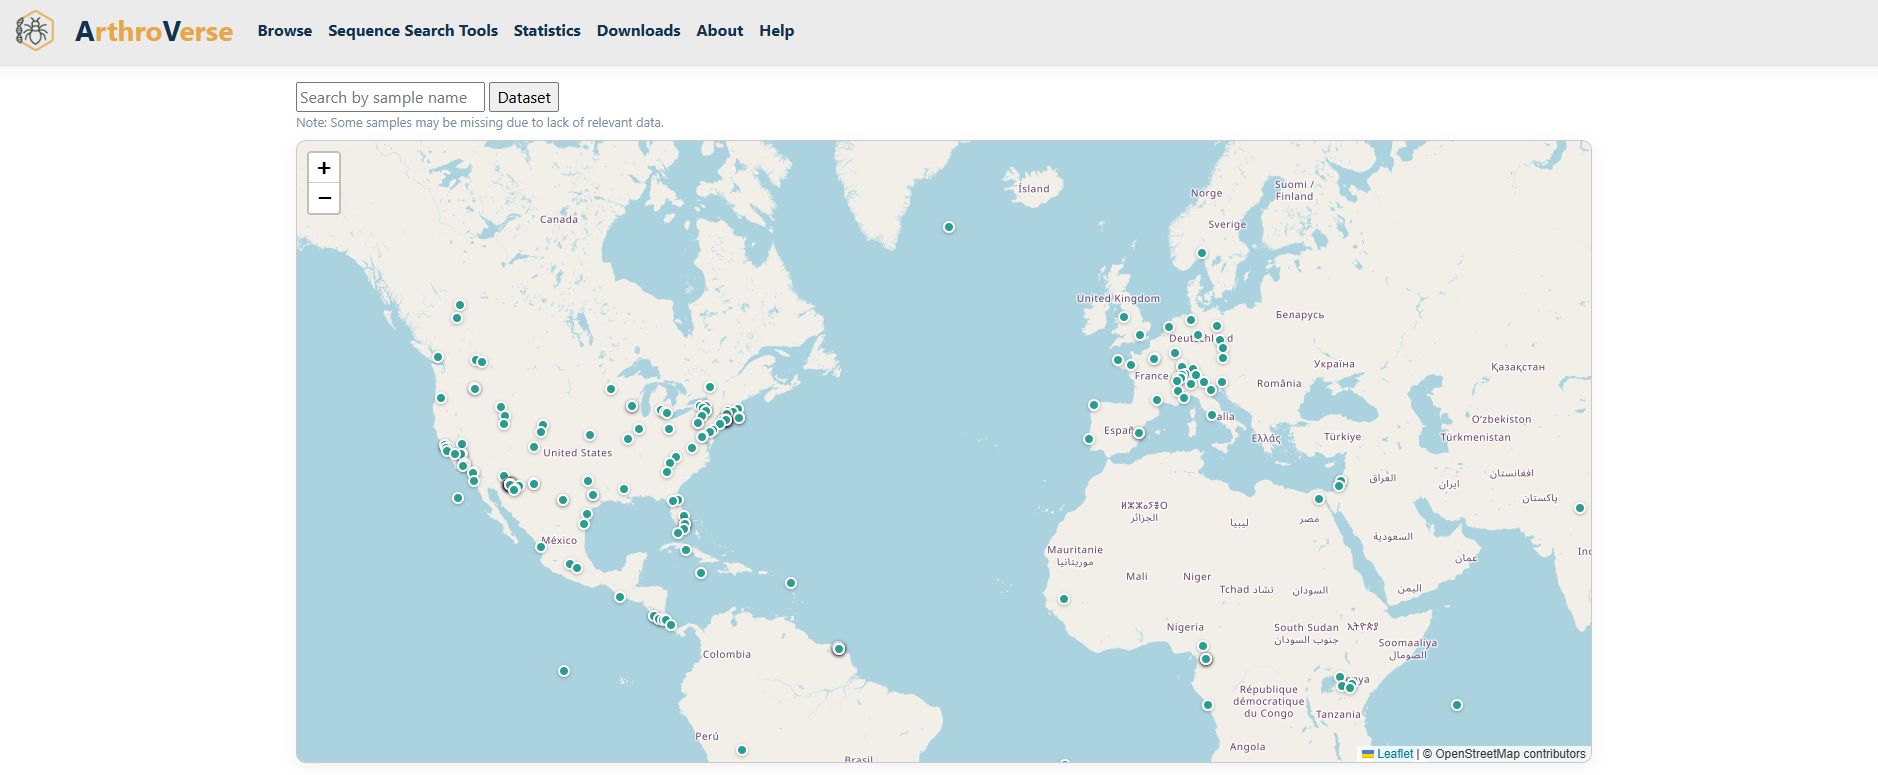
Map
The Map view plots samples geographically using their recorded latitude and longitude. Each marker is a sampling site; click a marker for its details. Maps also appear on individual Sample and Family pages to show where the underlying data was collected.
Sequence Search Tools
The Sequence Search Tools let you query the database with your own data — a sequence, a profile, a motif, or a structure — and find the matching protein families. Pick the tool that fits what you already have. Whichever you use, the hits link straight to the relevant Family Info page.
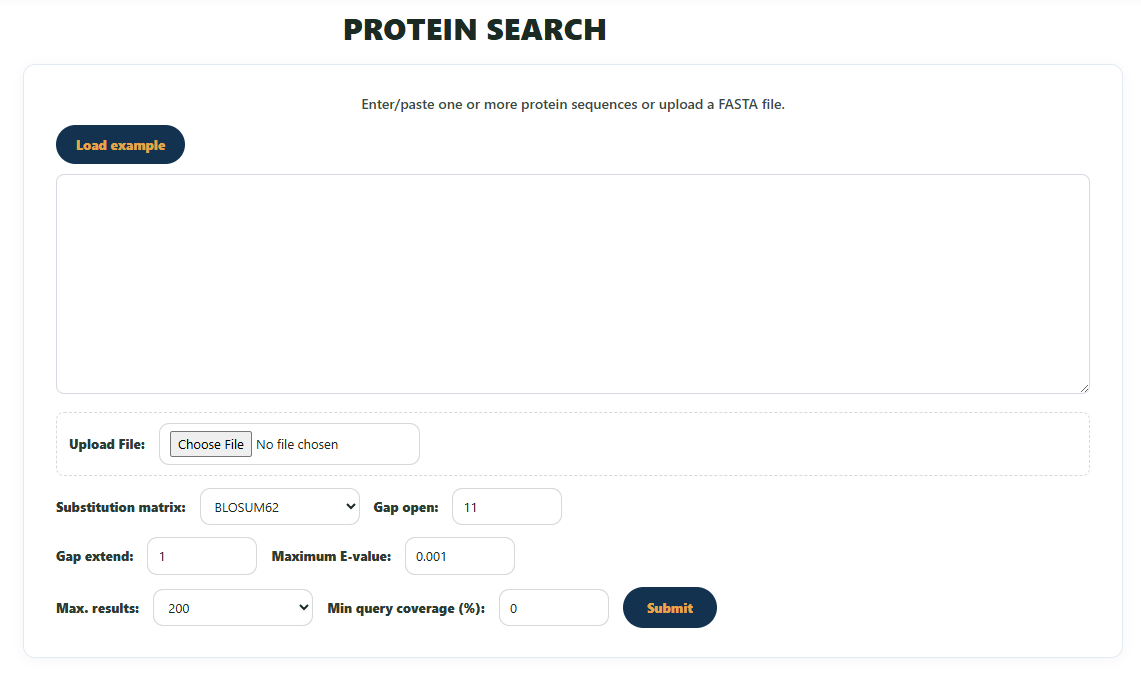
Diamond
Fast protein similarity search. Paste one or more amino-acid sequences (FASTA) and DIAMOND aligns them against the family representative sequences, returning the best hits ranked by alignment score and e-value. Use this when you have a sequence and want a quick "what is this similar to?" answer. A Load example button fills the box with a sample query.
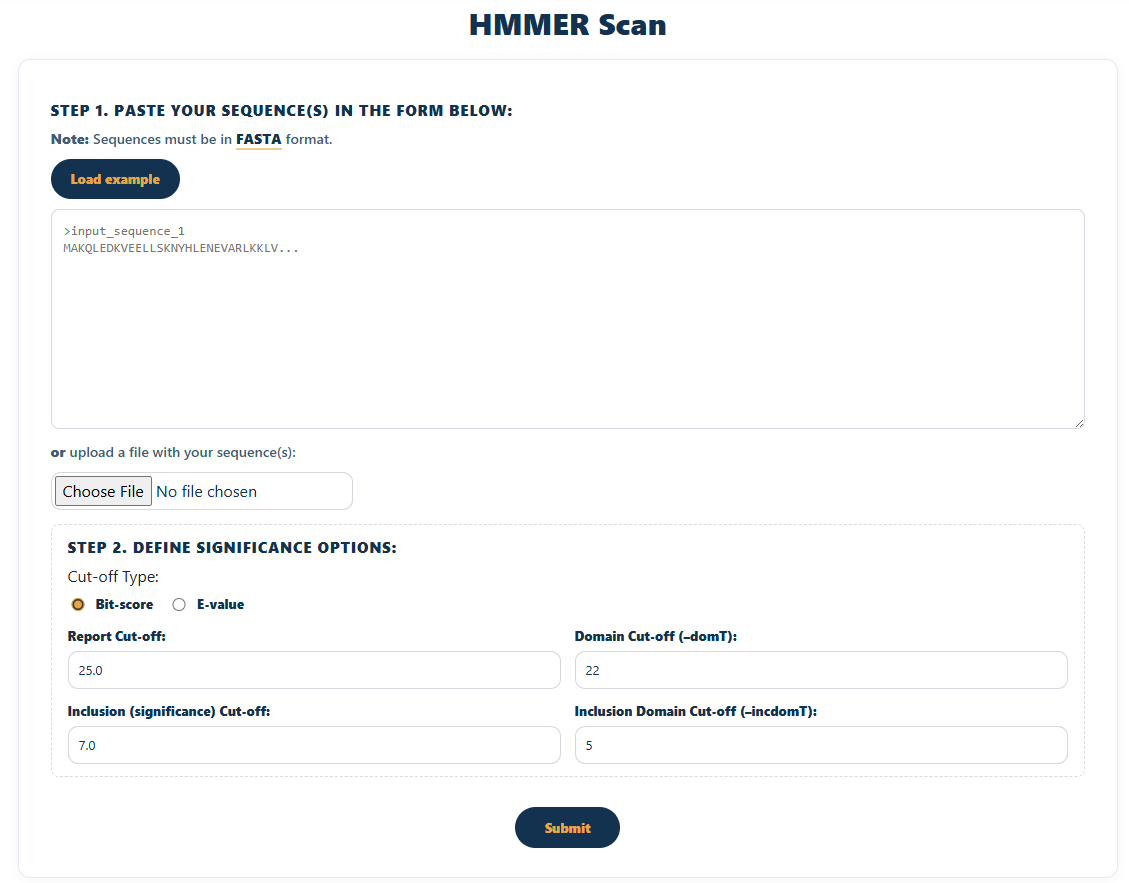
HMMER by Sequence
Profile-based search starting from a sequence. Submit a query sequence and HMMER scores it against the family hidden Markov models, which is more sensitive to remote homologs than a plain alignment. Hits are reported with bit scores and e-values, each expandable to show the alignment.
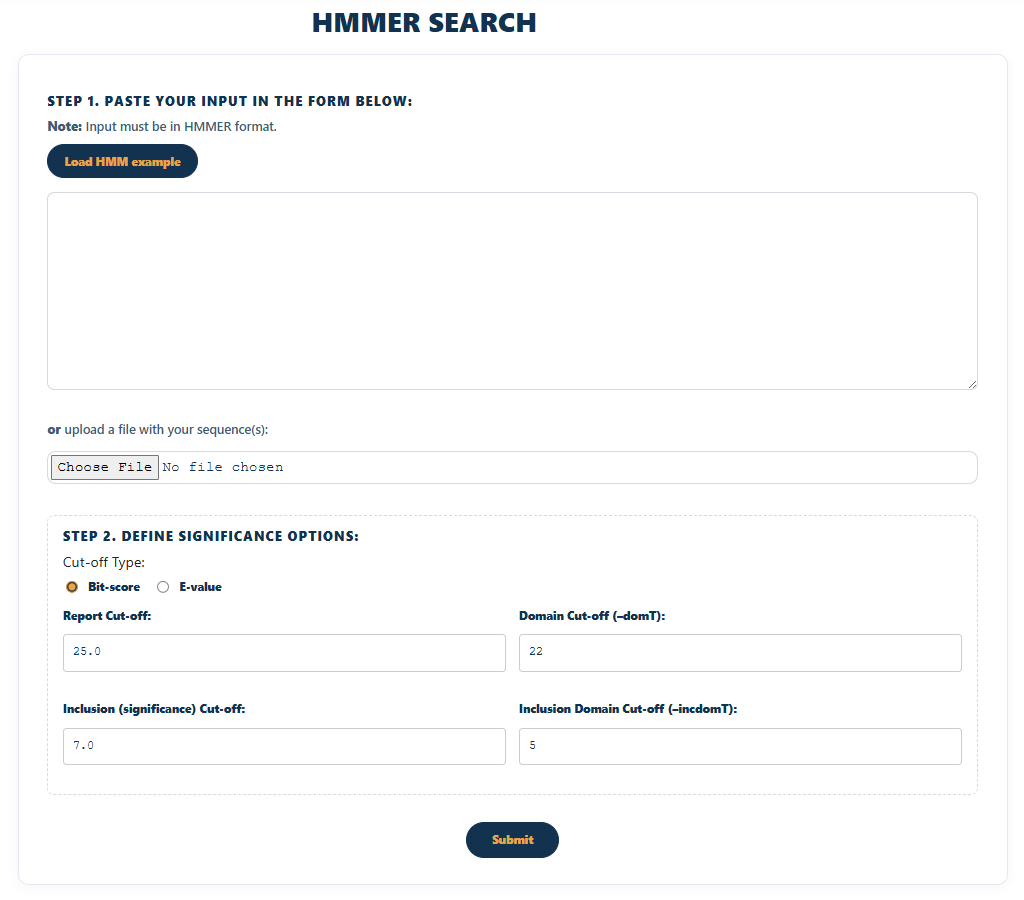
HMMER by Model
If you already have an HMM profile — for example one downloaded from this site, or built from your own alignment — upload it here to search the database with your model directly. Useful for comparing a curated profile against ArthroVerse families.
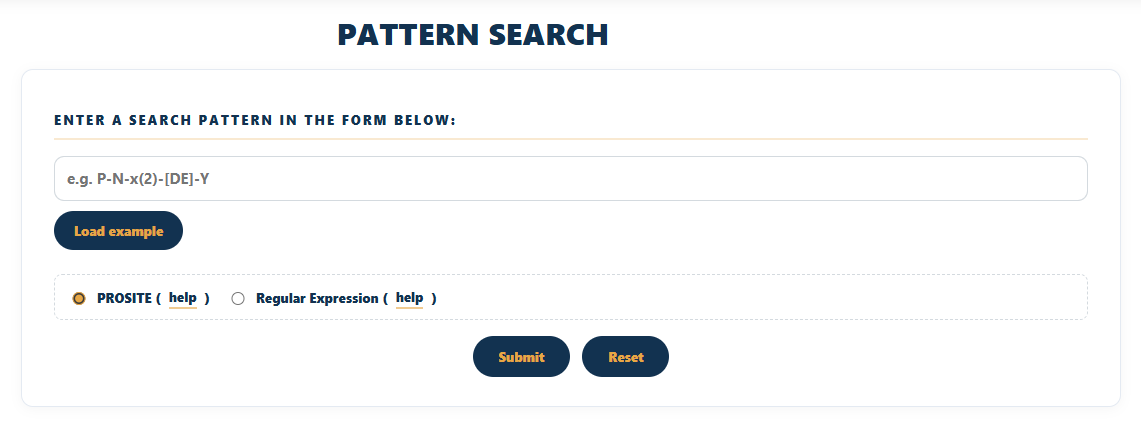
Pattern Search
Search by a sequence motif or pattern (e.g. a PROSITE-style expression) rather than a full sequence. Enter the pattern and ArthroVerse returns families whose sequences contain a match, with the matched region highlighted in the consensus. Ideal for locating short conserved sites or signatures.
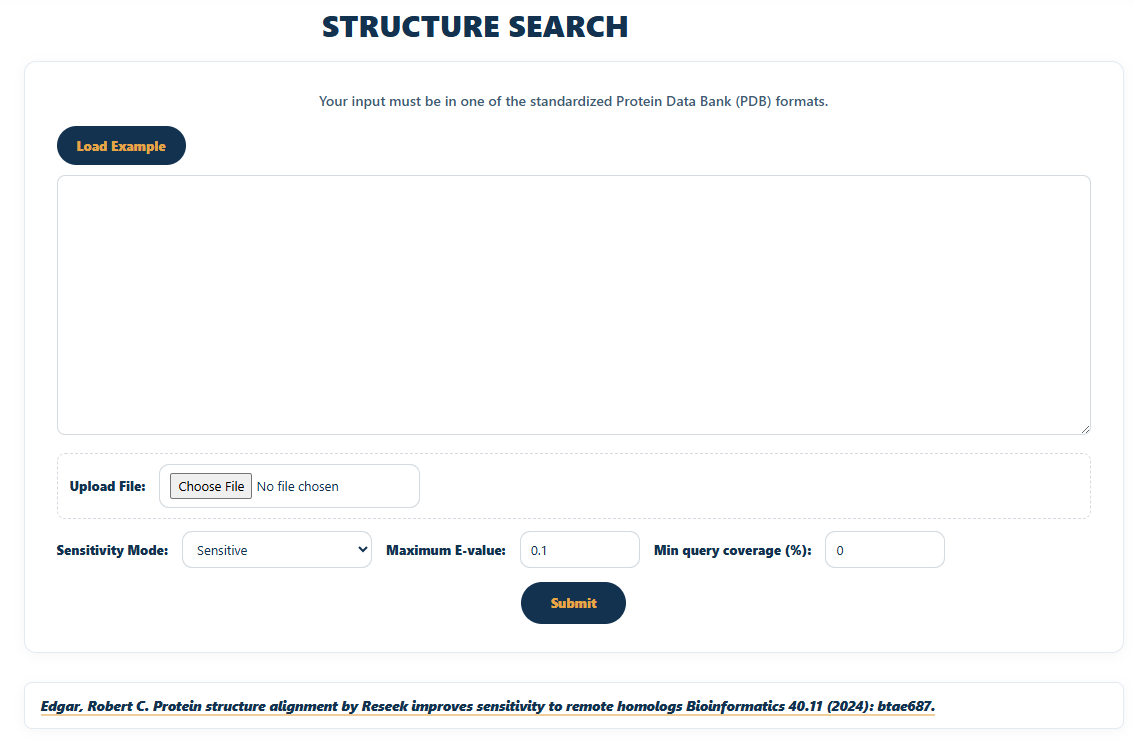
Structure Search
Search by 3D structure. Provide a structure file and the tool compares its fold against the family models, surfacing structurally similar families even when sequence similarity is low. Results connect through to the family's structure and feature viewers (PDBe Molstar, Feature Viewer) and external references such as PDB, CATH, and AlphaFold.
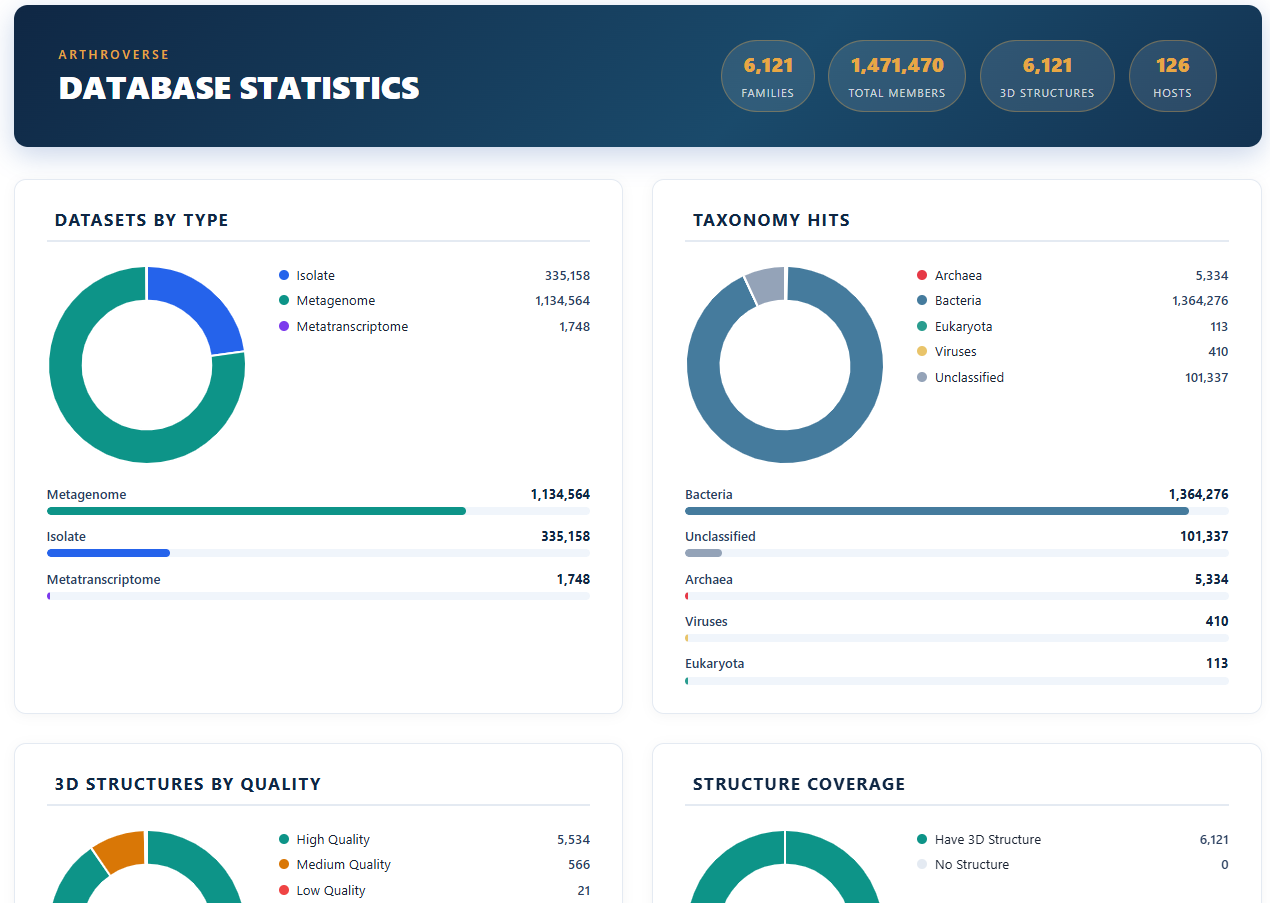
Statistics
The Statistics page gives a database-wide overview: total counts of families, samples, and scaffolds, distributions across taxonomic orders and sample types, and the spread of model quality and confidence scores. Use it to understand the overall scale and composition of ArthroVerse before drilling into individual records, or to cite summary figures.
Downloads
The Downloads section provides the underlying data for offline use. Depending on the record, you can obtain:
- FASTA — family sequences, plus an aligned (MSA) version.
- HMM — the hidden Markov model profile for a family.
- CIF — the predicted 3D structure file.
Per-family download buttons also appear directly on each Family Info page, alongside the MSA, structure, and HMM logo viewers.

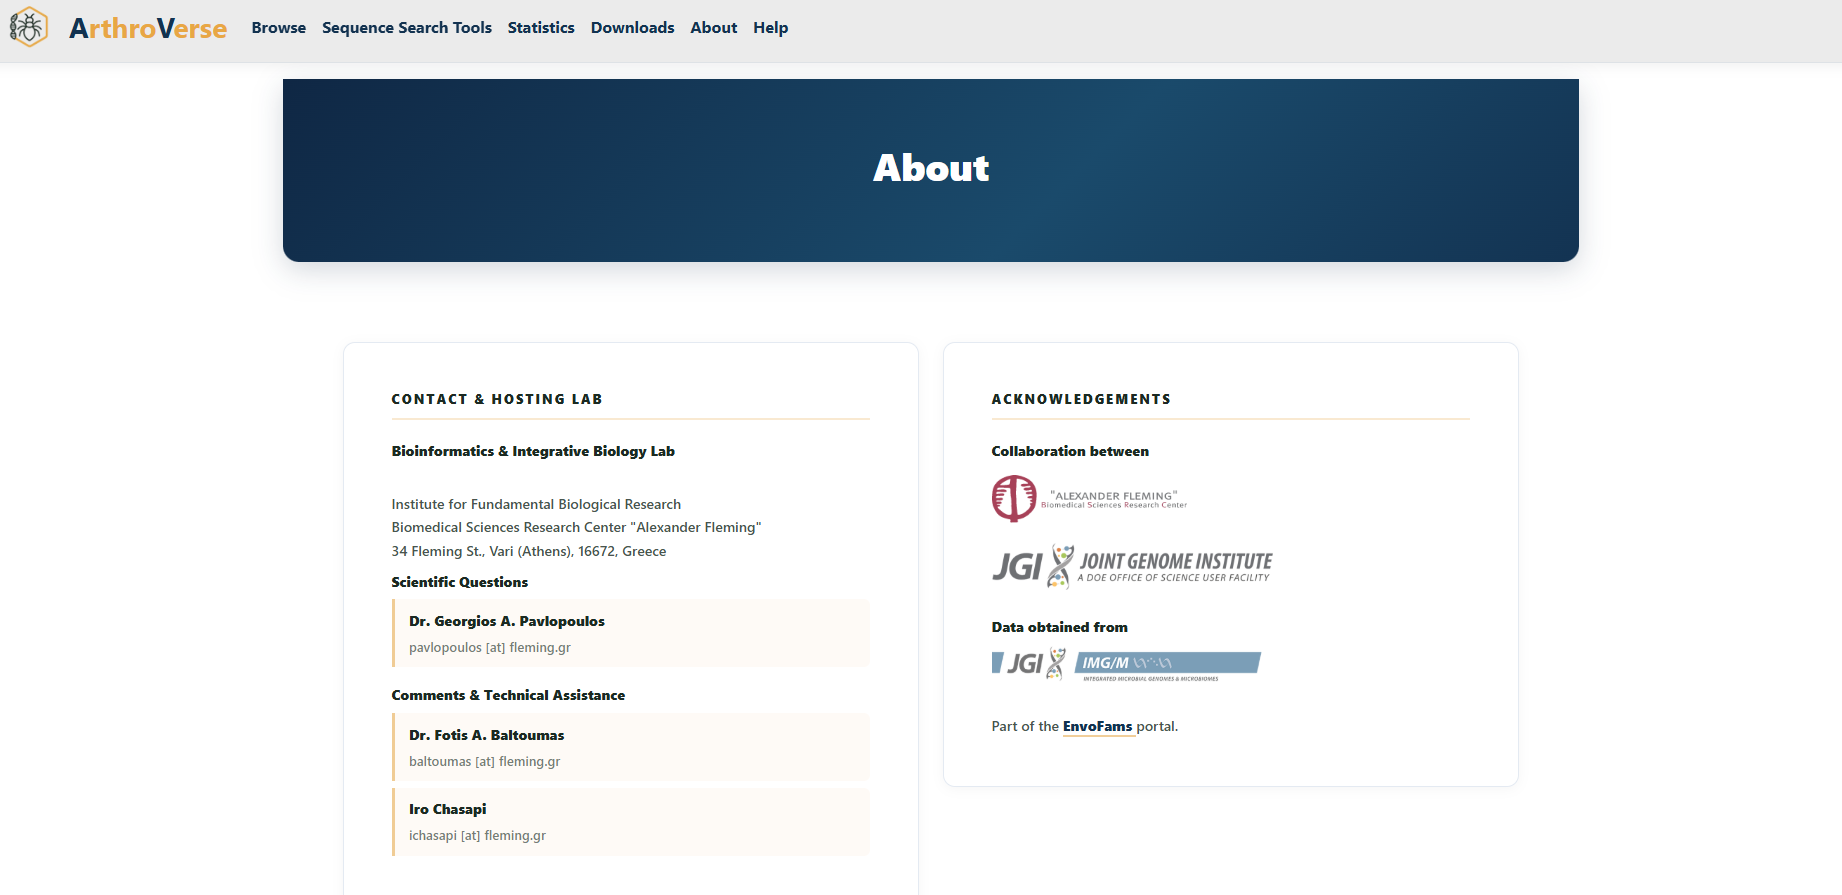
About
The About page describes the purpose and scope of ArthroVerse, how the protein families were constructed, the data sources used, and how to cite the resource. It also credits the tools that power the site's viewers and analyses — including DIAMOND, HMMER, PDBe Molstar, Feature Viewer, Skylign, and data from IMG/JGI, NCBI, Pfam/InterPro, CATH, and AlphaFold — along with contact details for the team.
Help
You're reading it. This Help page documents every section of the navigation menu. If something isn't covered here, or you spot an error in the data, please get in touch via the contact details on the About page.